01 Projects list
Thirty projects at a glance
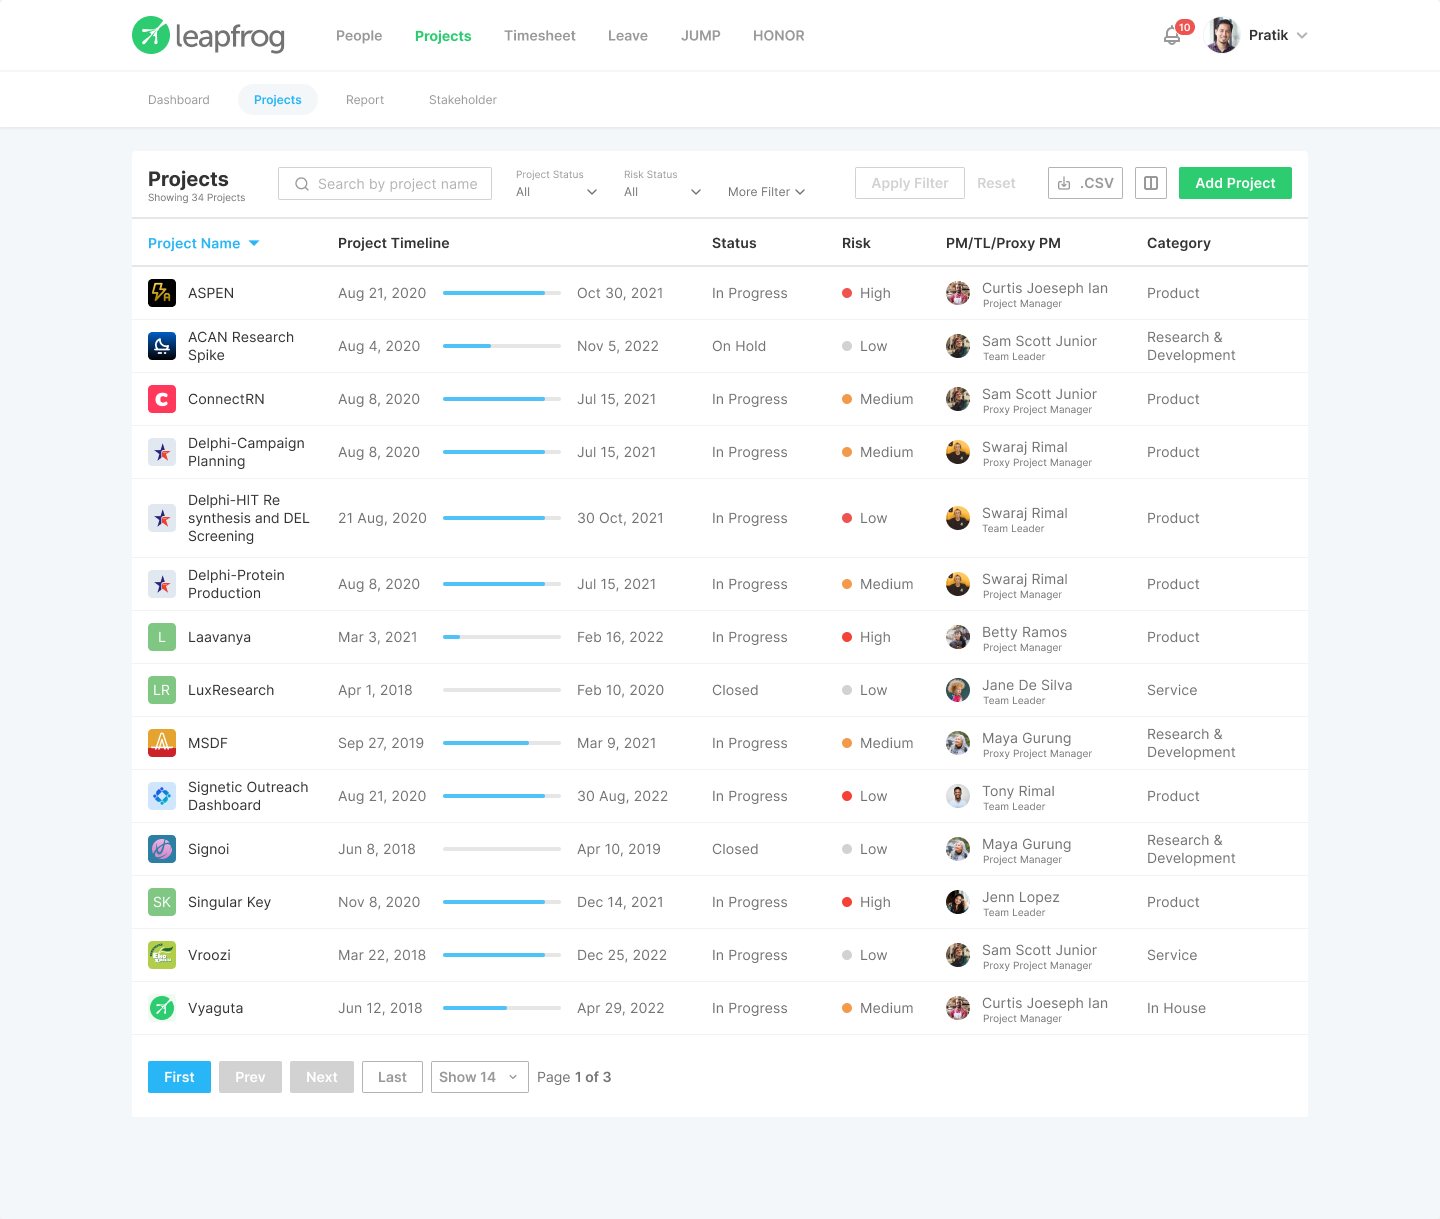
Status, owner, progress and category for every project in one sortable list, so executives stop asking for spreadsheet updates.
A platform that replaces scattered spreadsheets with intelligent dashboards. Executives monitor progress by project, managers understand how work connects, and teams stay updated. Converts messy project information into actionable insights, saves time, and keeps everyone on the same page.
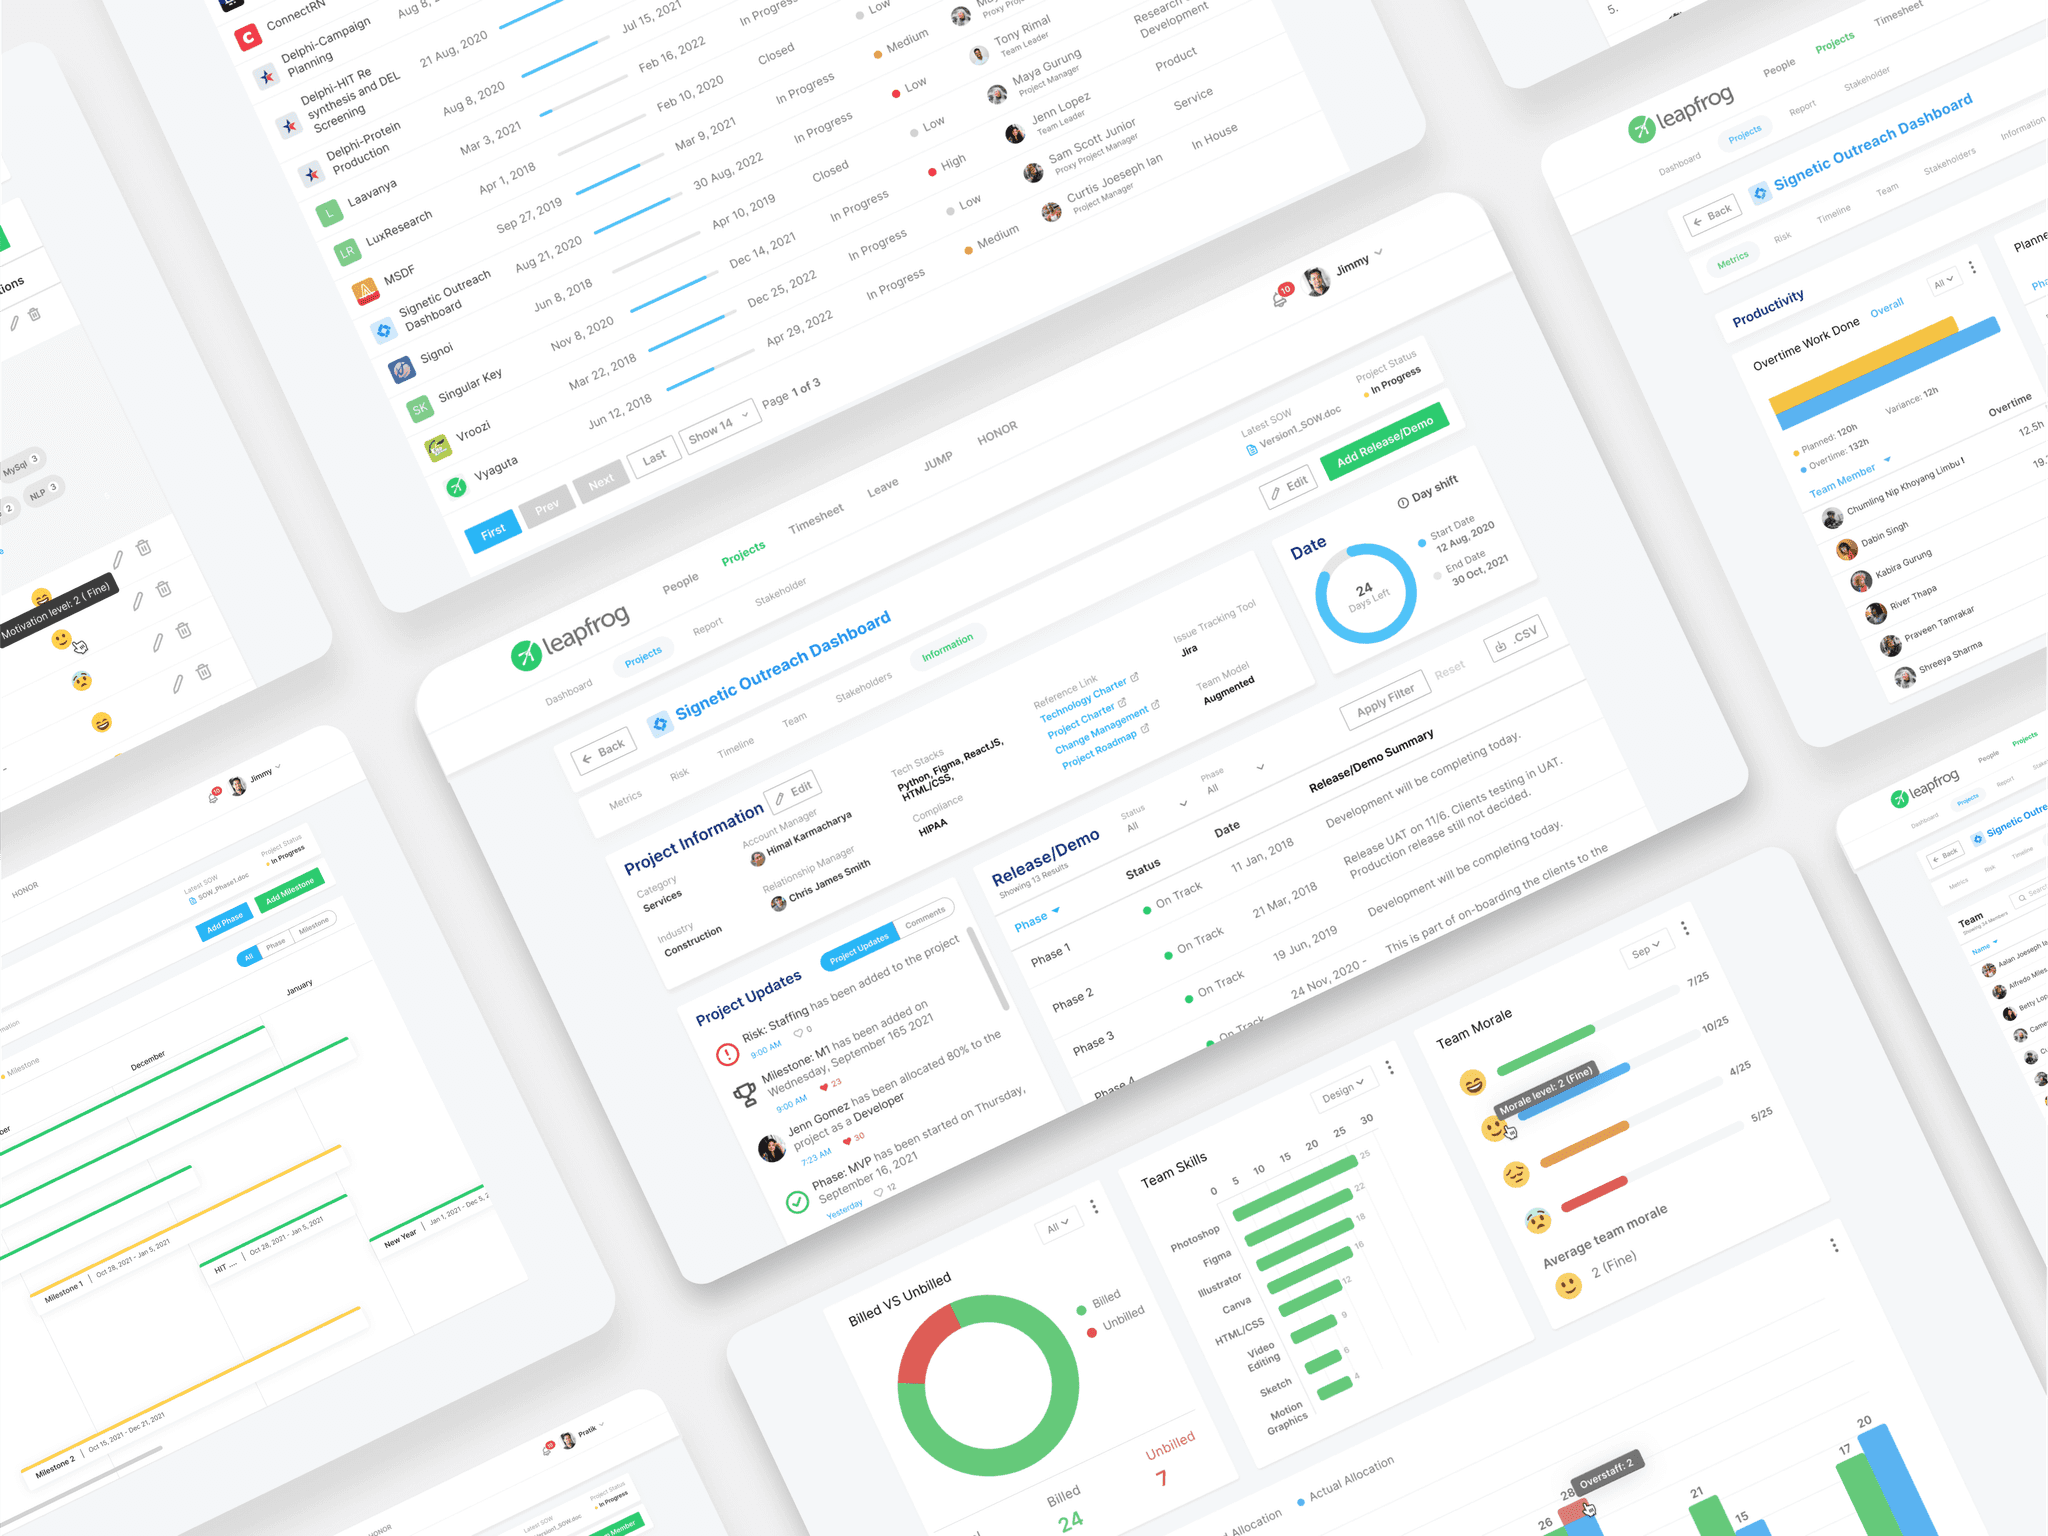
Leapfrog required a single solution to provide visibility into its portfolio of 30+ projects. Scattered spreadsheets and legacy tools were being used by teams, and decisions were made on disparate data. The system was required to balance the requirements of various stakeholders: executives required strategic visibility, PMs required clear priorities, and account managers required trustworthy reporting, and all this through a single source of truth.
The new system delivered measurable value across every team. Risk alerts enabled problems to be discovered sooner. There were fewer status meetings because real-time dashboards offered continuous visibility. Executives enjoyed clear portfolio visibility, project managers could easily track dependencies, and account teams generated reports in an instant. Above all, the solution put an end to spreadsheet anarchy by offering a single trusted source of all project data.
12-stakeholder analyses revealed three key pain points: executives had minimal visibility into current projects in real time, teams wasted over 15 hours a week reconciling spreadsheets, and risks were surfaced too late. These results called for an end-to-end tracking solution to address systemic inefficiencies.
Interviews across executives, project managers, account managers and team members surfaced the same three problems.
Every role looked at the same projects for a different reason, so the platform had to answer each of them from the same data.
Created information architecture and user flows for each role and turned them into testable wireframes. After refining executive dashboards, PM tools, and team workspaces based on user feedback, we had a solid foundation for development of the prototypes.
The Projects module in two levels: a list to find any project fast, and a project page whose six tabs answer what each role needs to know.
The Risk page upgrades Leapfrog's old risk register. Here's the path a single risk takes through it.
Built interfaces for executives, project managers, and team members using Leapfrog's existing design system. Executives gained full portfolio insight, PMs received enhanced risk tracking features, and teams were provided with easy-to-use task management workplaces.
Eight core screens, from the portfolio list to timelines, metrics and risks. Each one answers a question a stakeholder raised in research.
Pick a screen, then hover (or scroll) the frame to move through the full design.
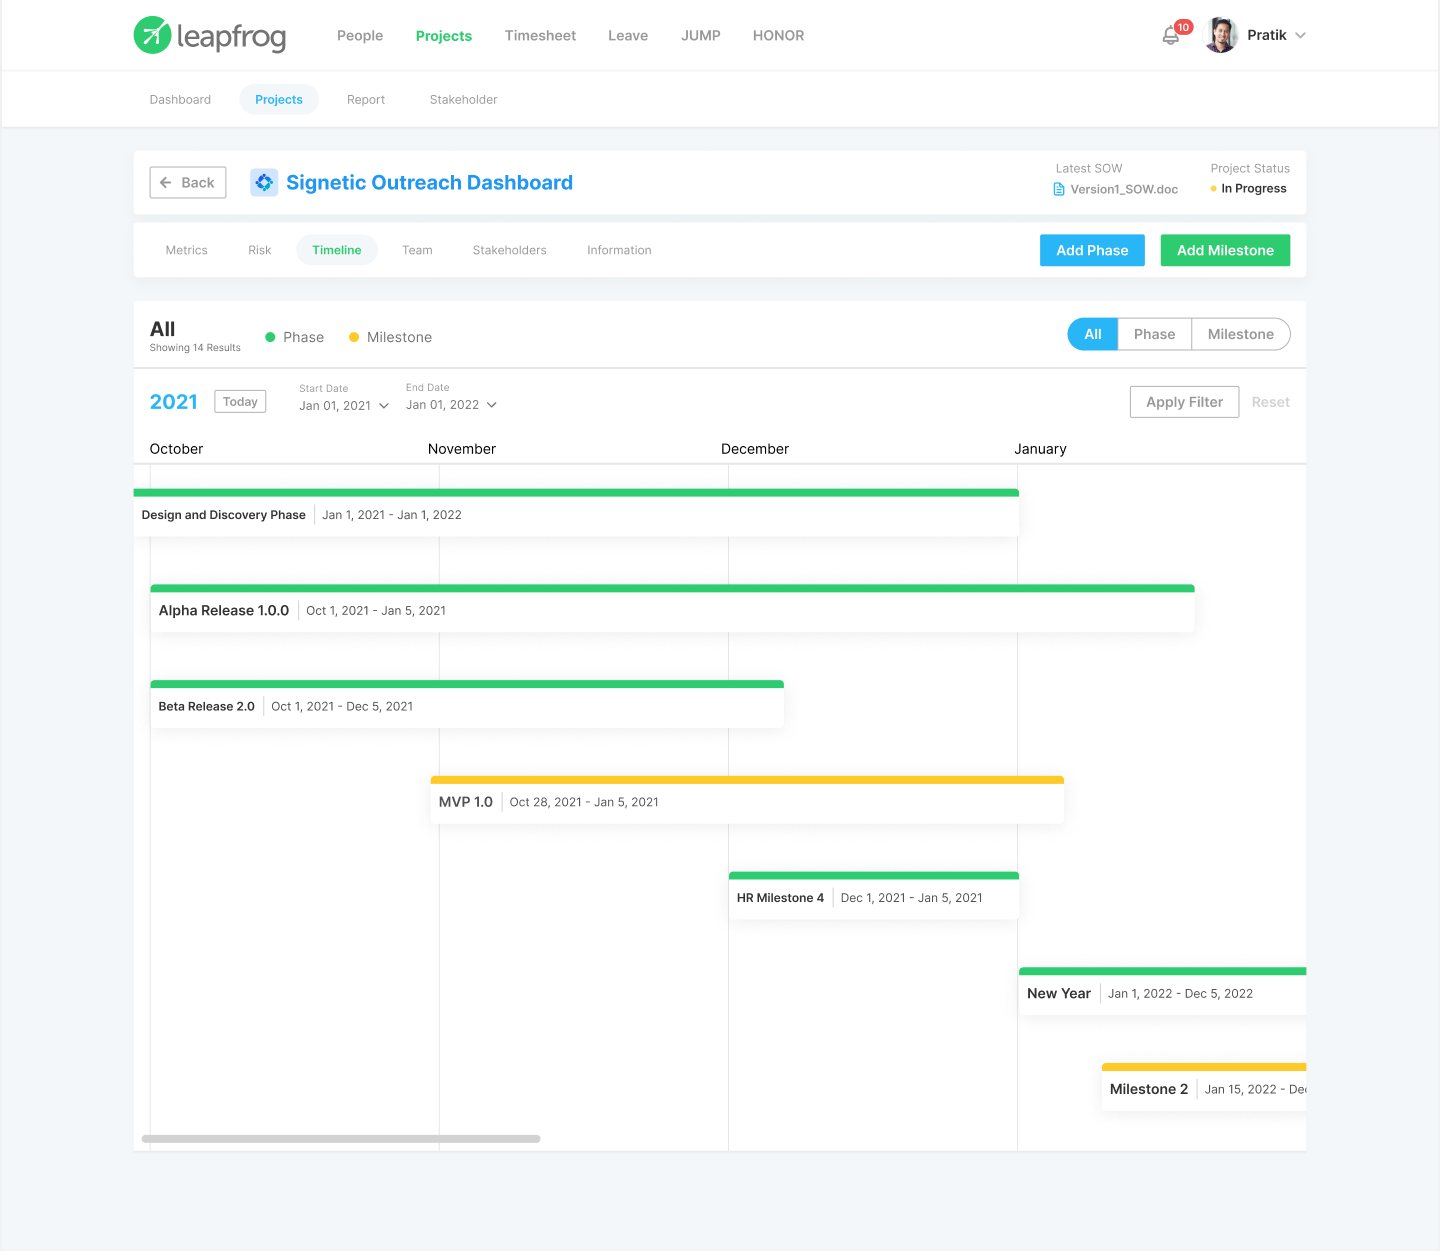
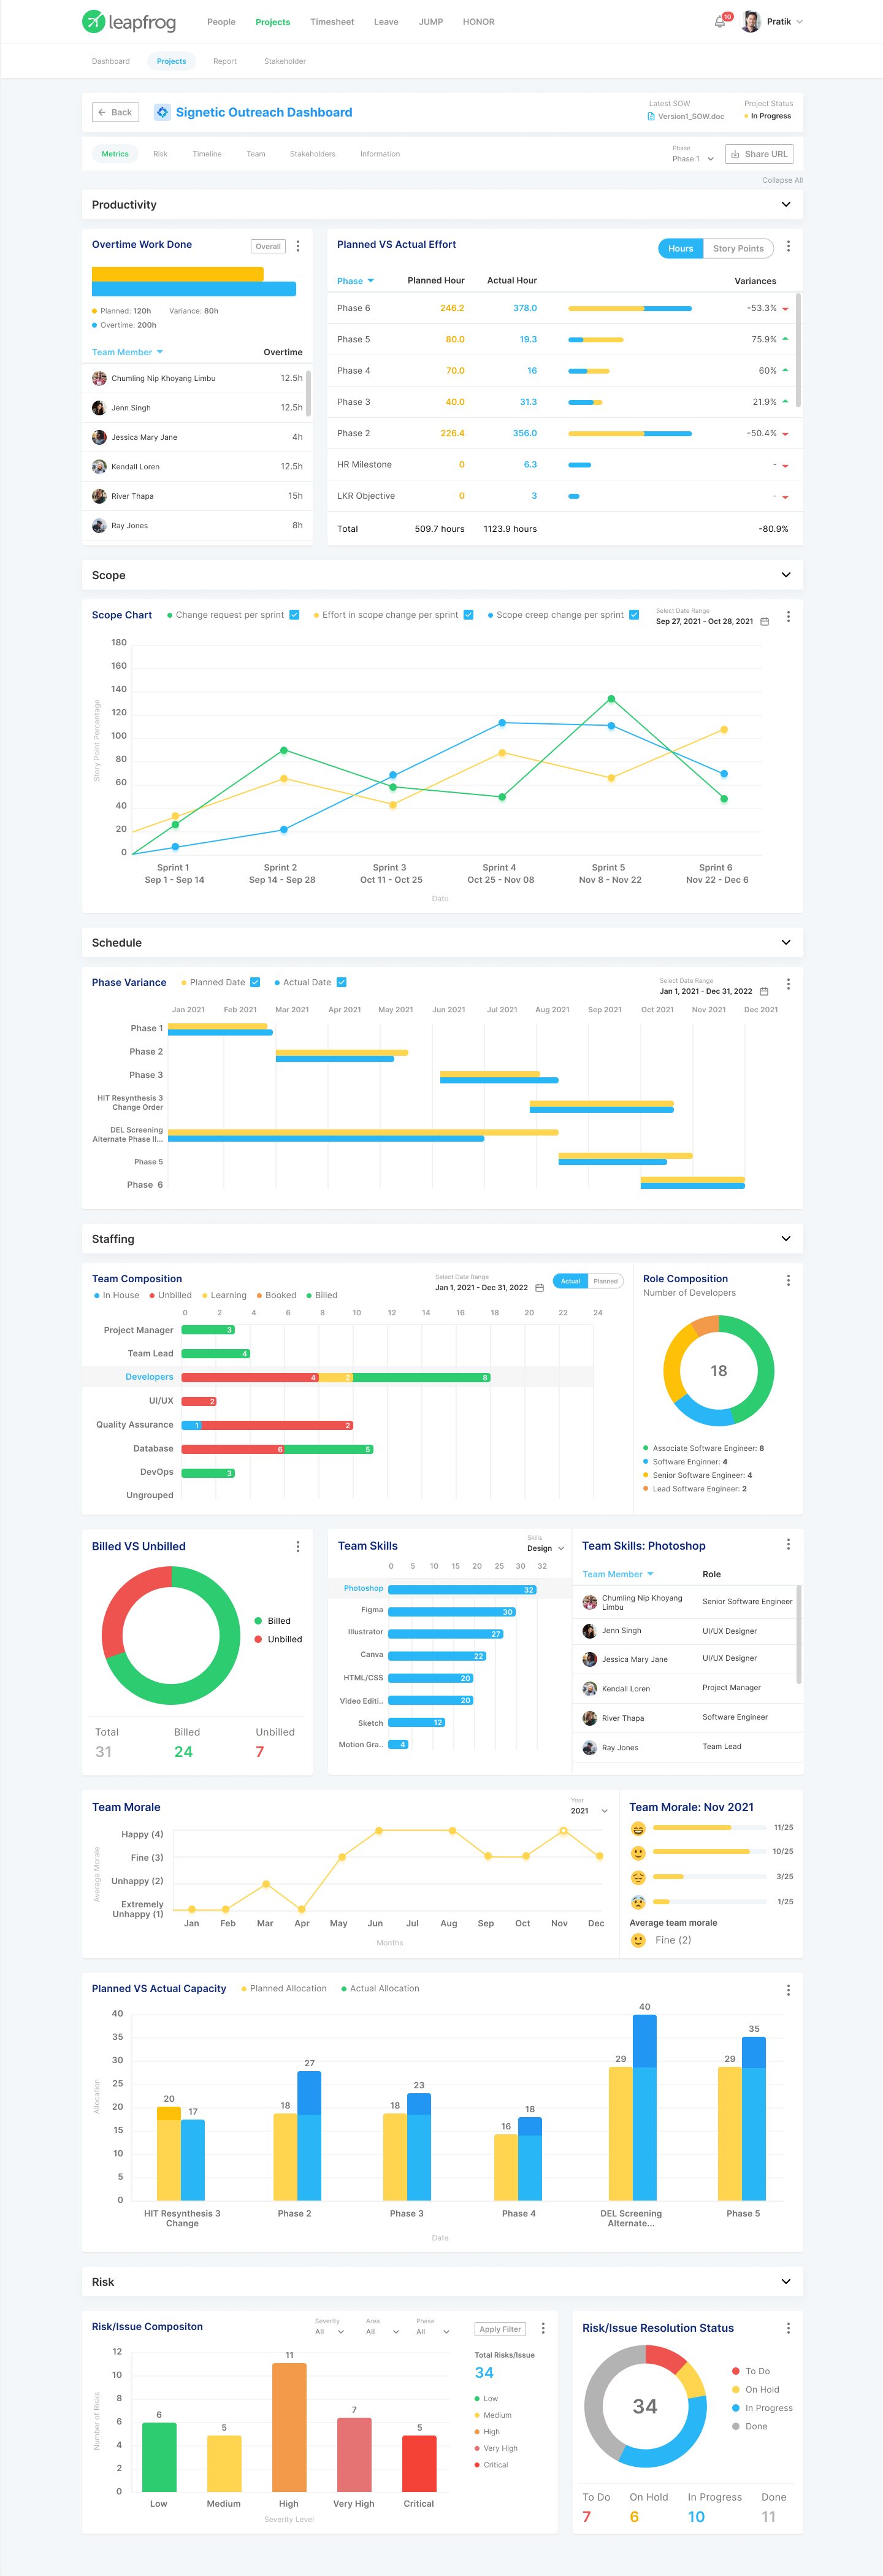
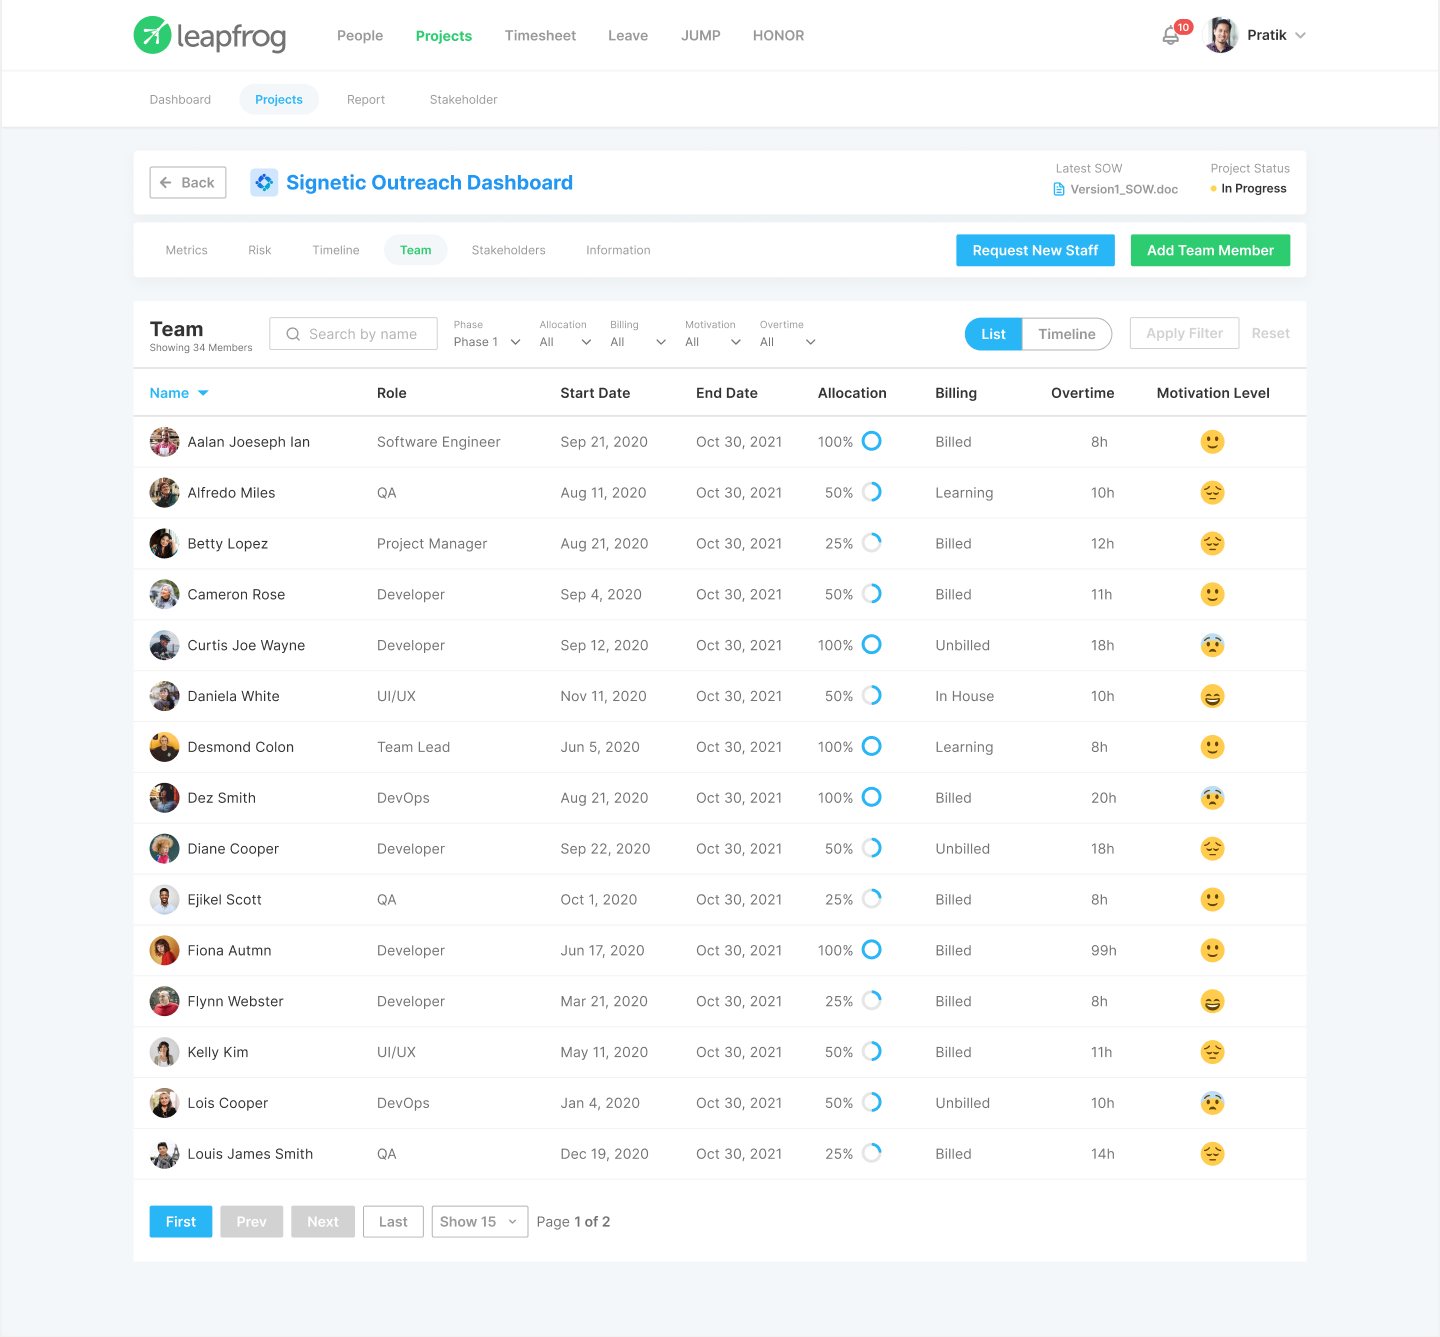
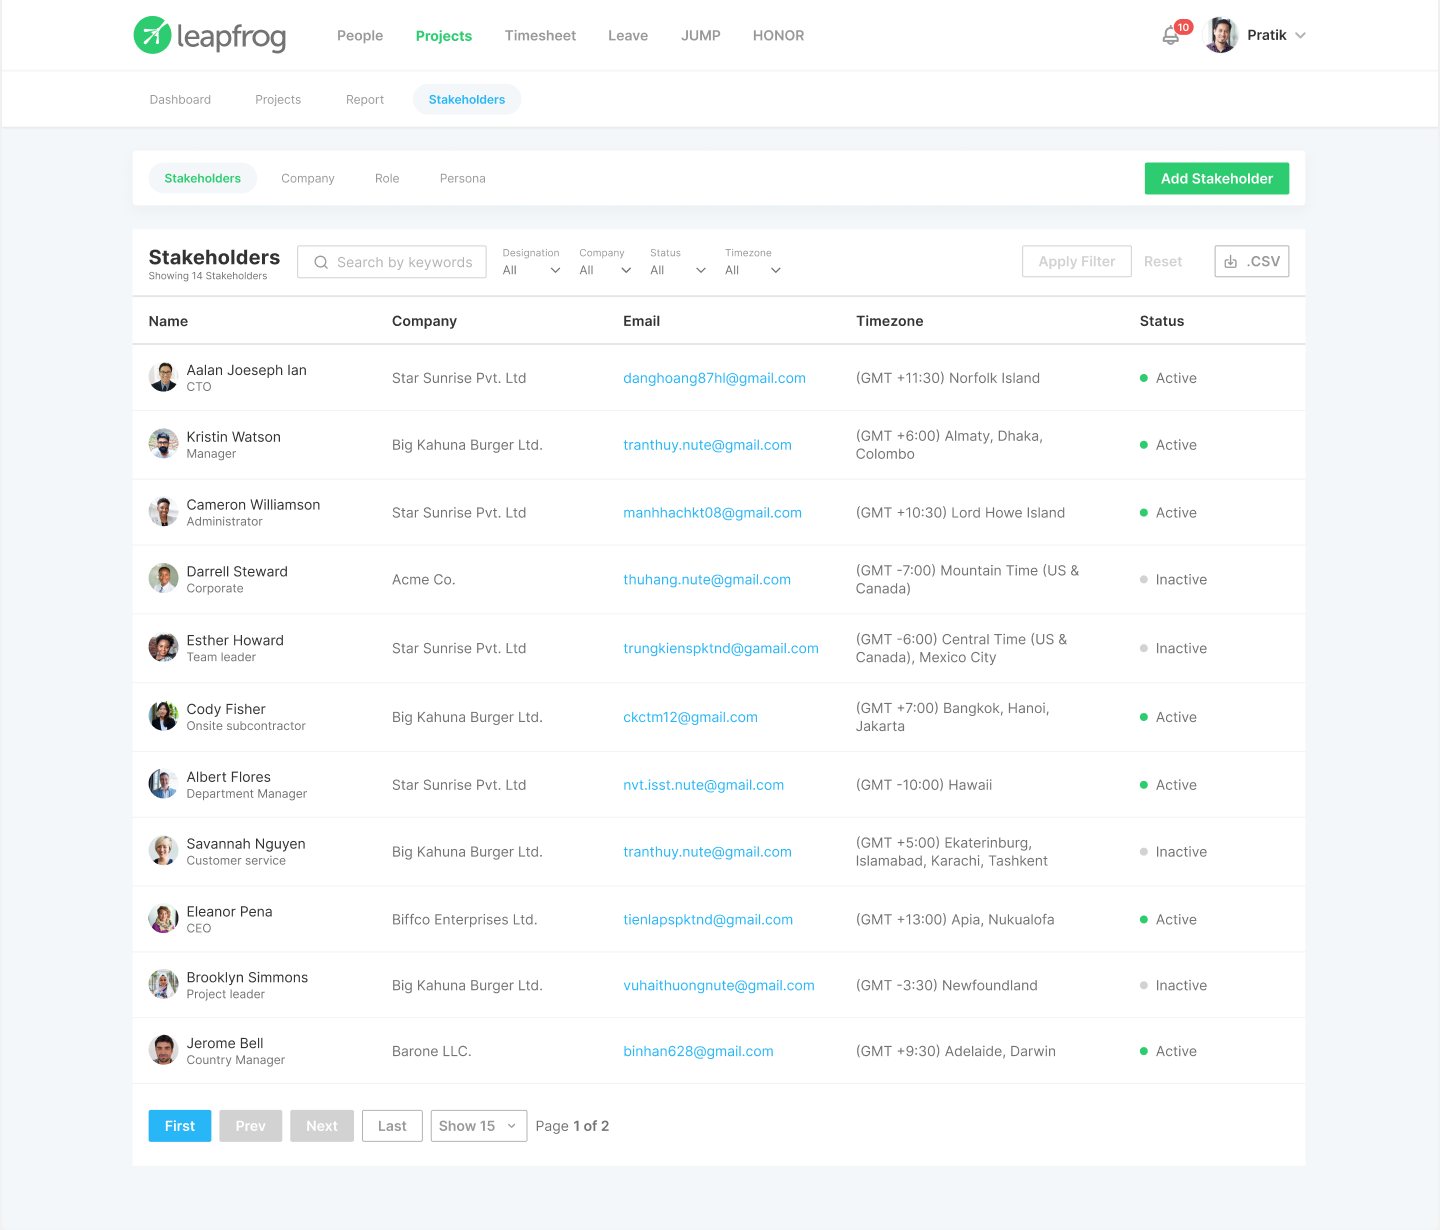
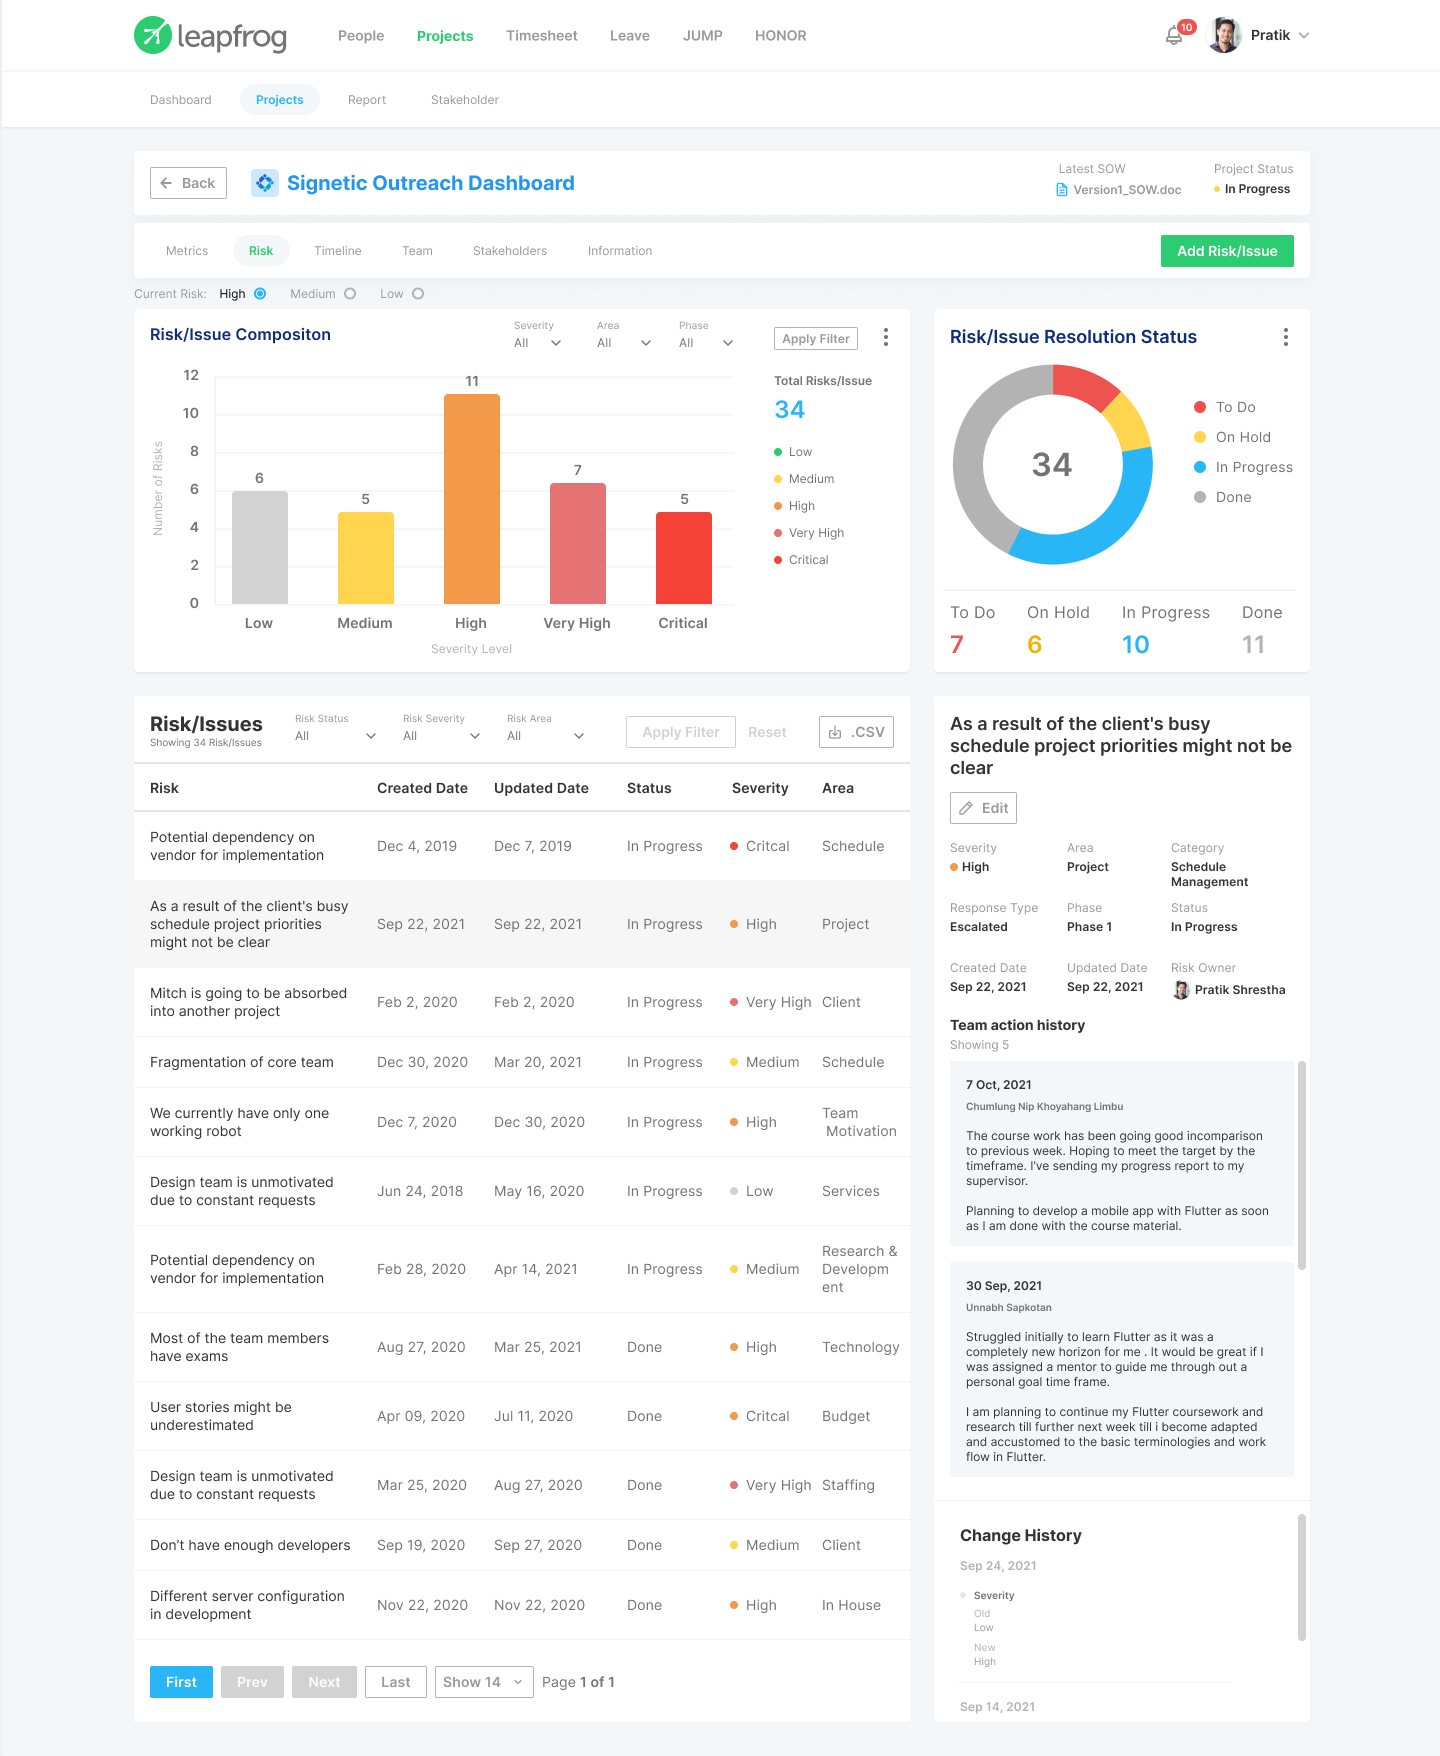
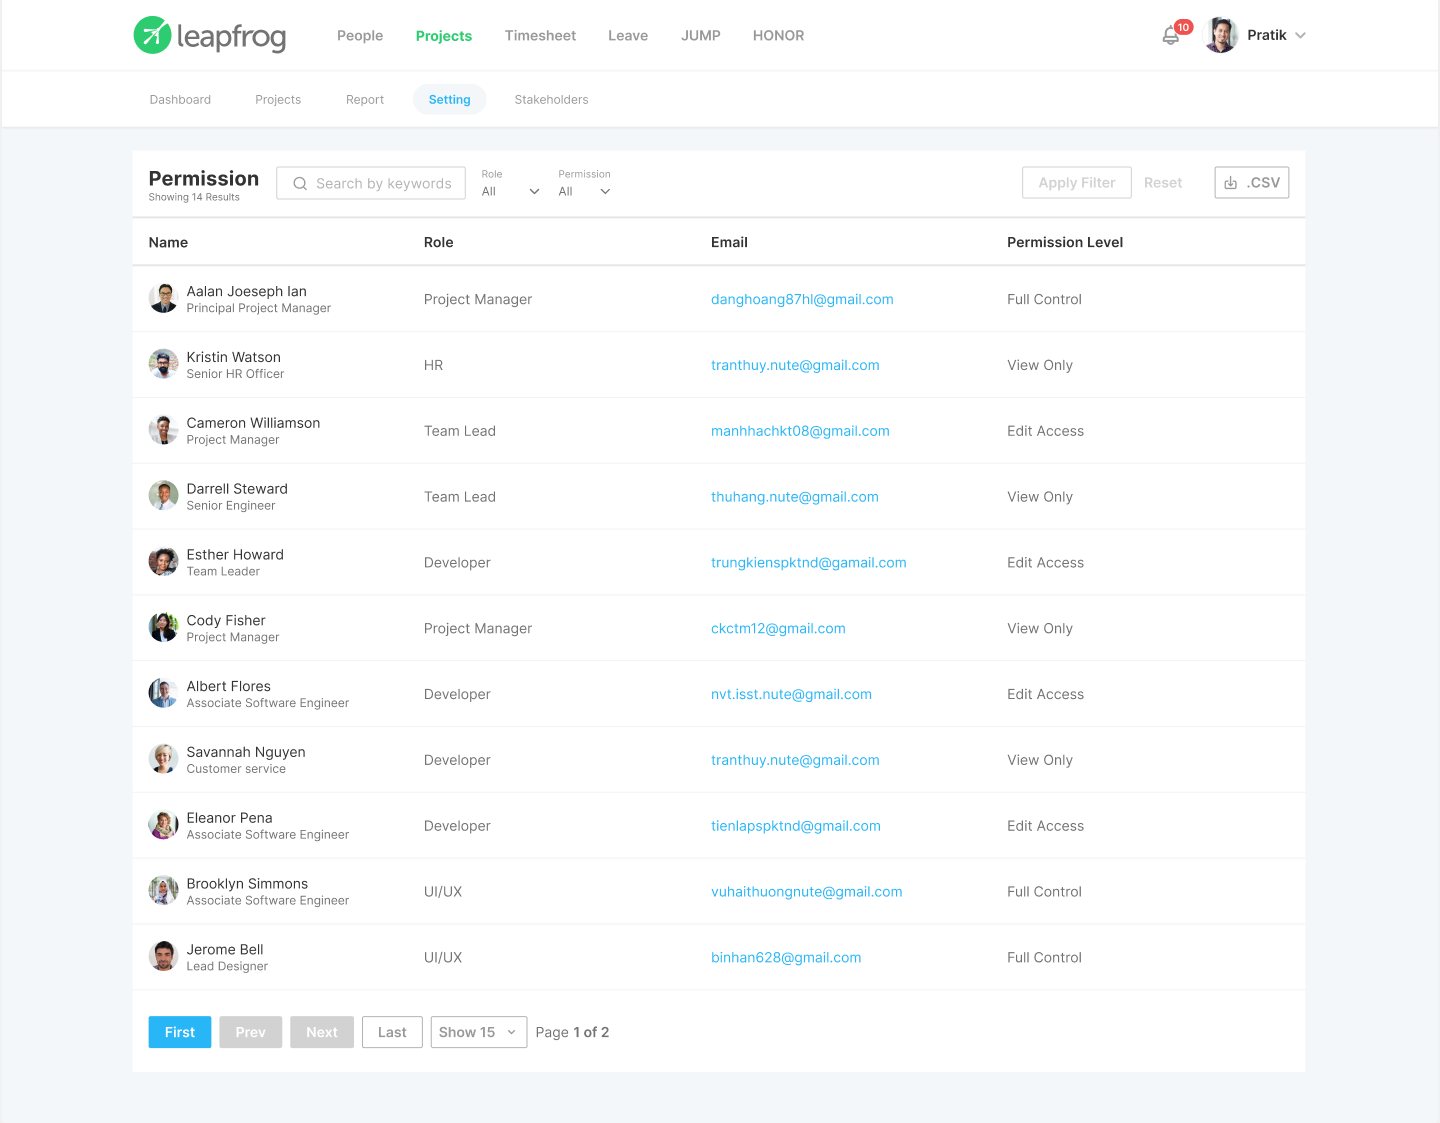
Six moments where a stakeholder's question became part of the interface.
Status, owner, progress and category for every project in one sortable list, so executives stop asking for spreadsheet updates.
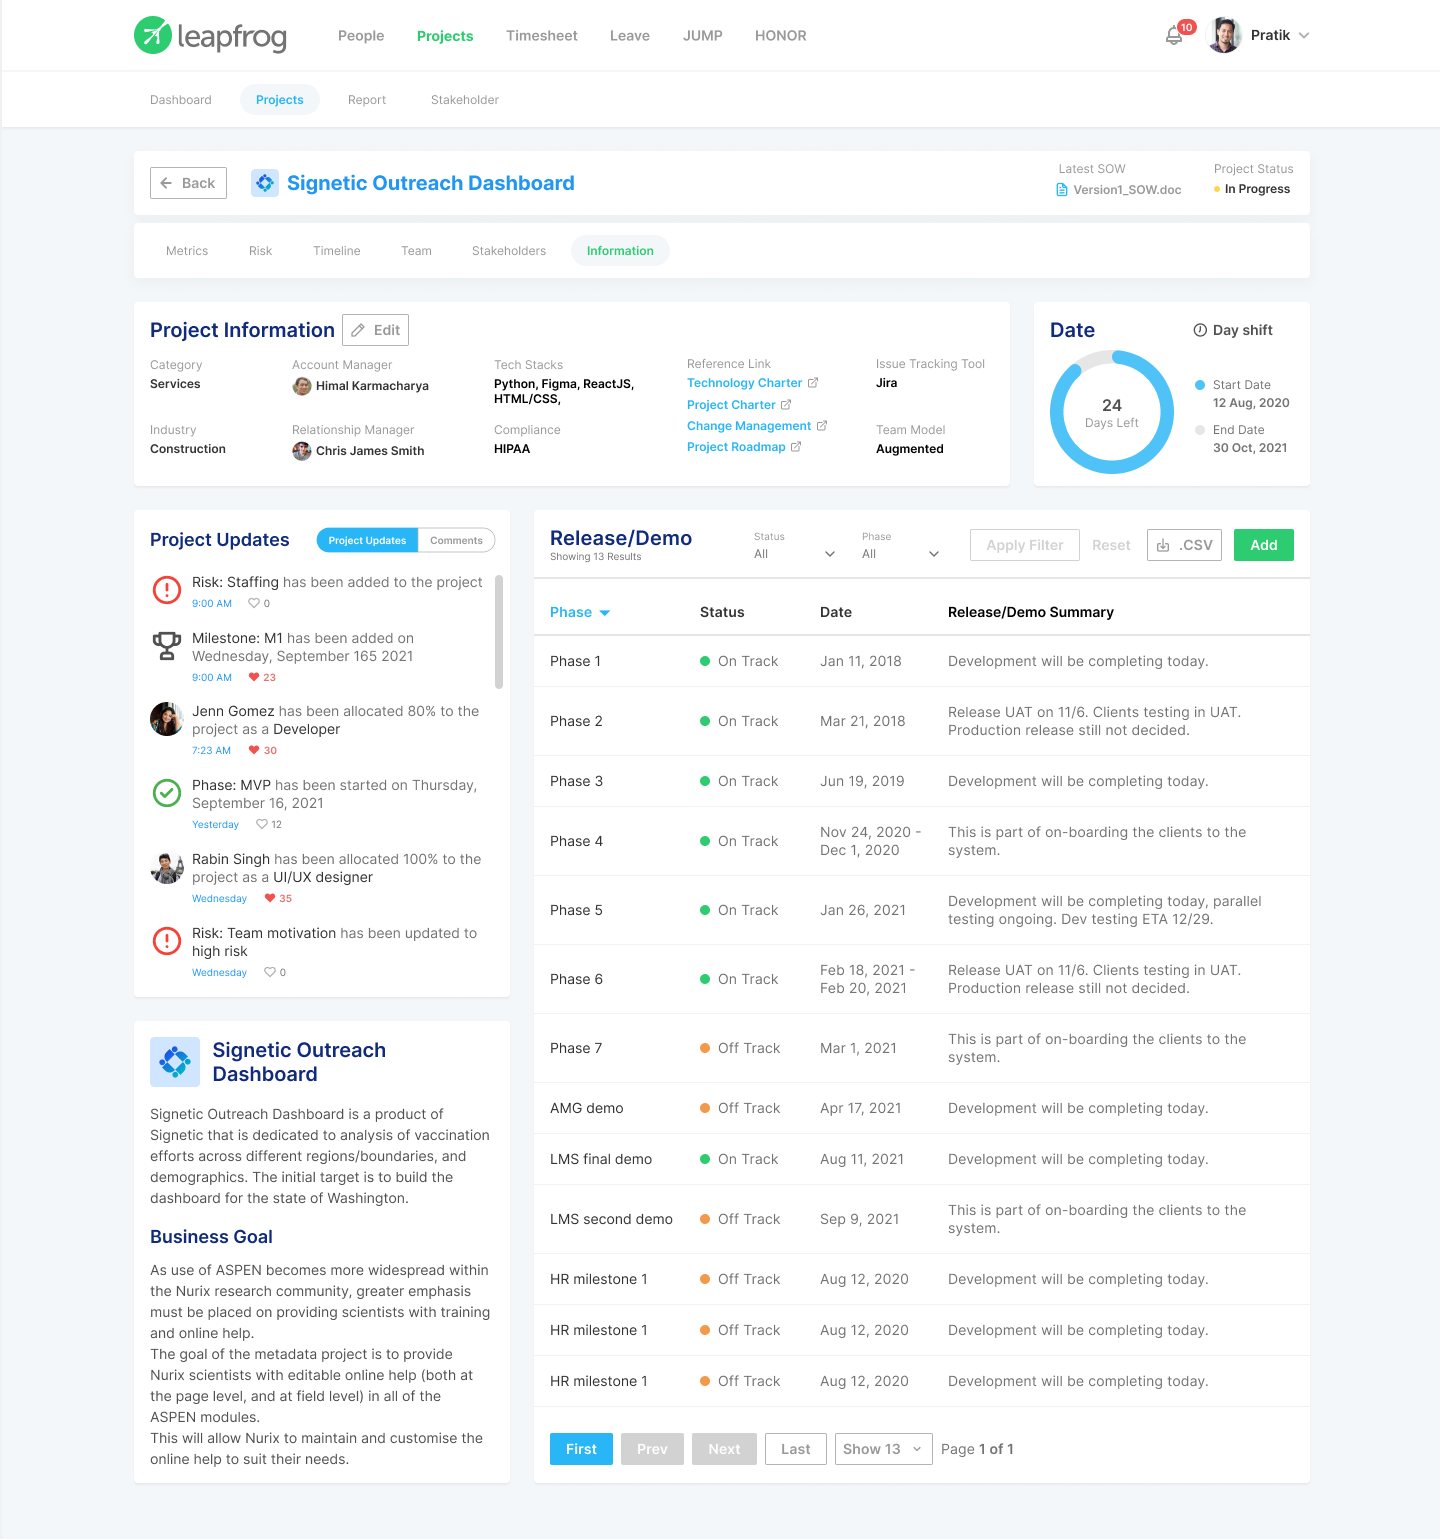
Goals, health, team and the latest updates live together, so a new PM can get up to speed in minutes.
A Gantt view of phases and milestones makes slipping work and blocked handoffs obvious before they become late.
Requested, effort and changes per sprint on one chart, so scope conversations start from data instead of memory.
Team composition, billed vs unbilled and skills in one band, built for account managers who report to clients.
A live chart of open risks by severity plus the register itself, upgrading Leapfrog's old spreadsheet into something teams act on.
The platform was 100% adopted within 8 weeks of launch. Risk resolution time was reduced by 60%, and status meetings were reduced by 40% due to real-time dashboards. Project timelines, team capacity views, and risk breakdowns were features that teams utilized actively.
“Tanisi was amazing to work with! She took our rough ideas and turned them into something even better than we imagined. Super responsive, sharp eye for detail, and just a genuinely great person to collaborate with!”

Pratik ShresthaVice President, Operations | Leapfrog Technology
Creative direction, brand and website for a Nepal-based clean-energy group developing hydropower, solar and pumped storage, presenting a 500 MW portfolio to investors, partners and future hires.
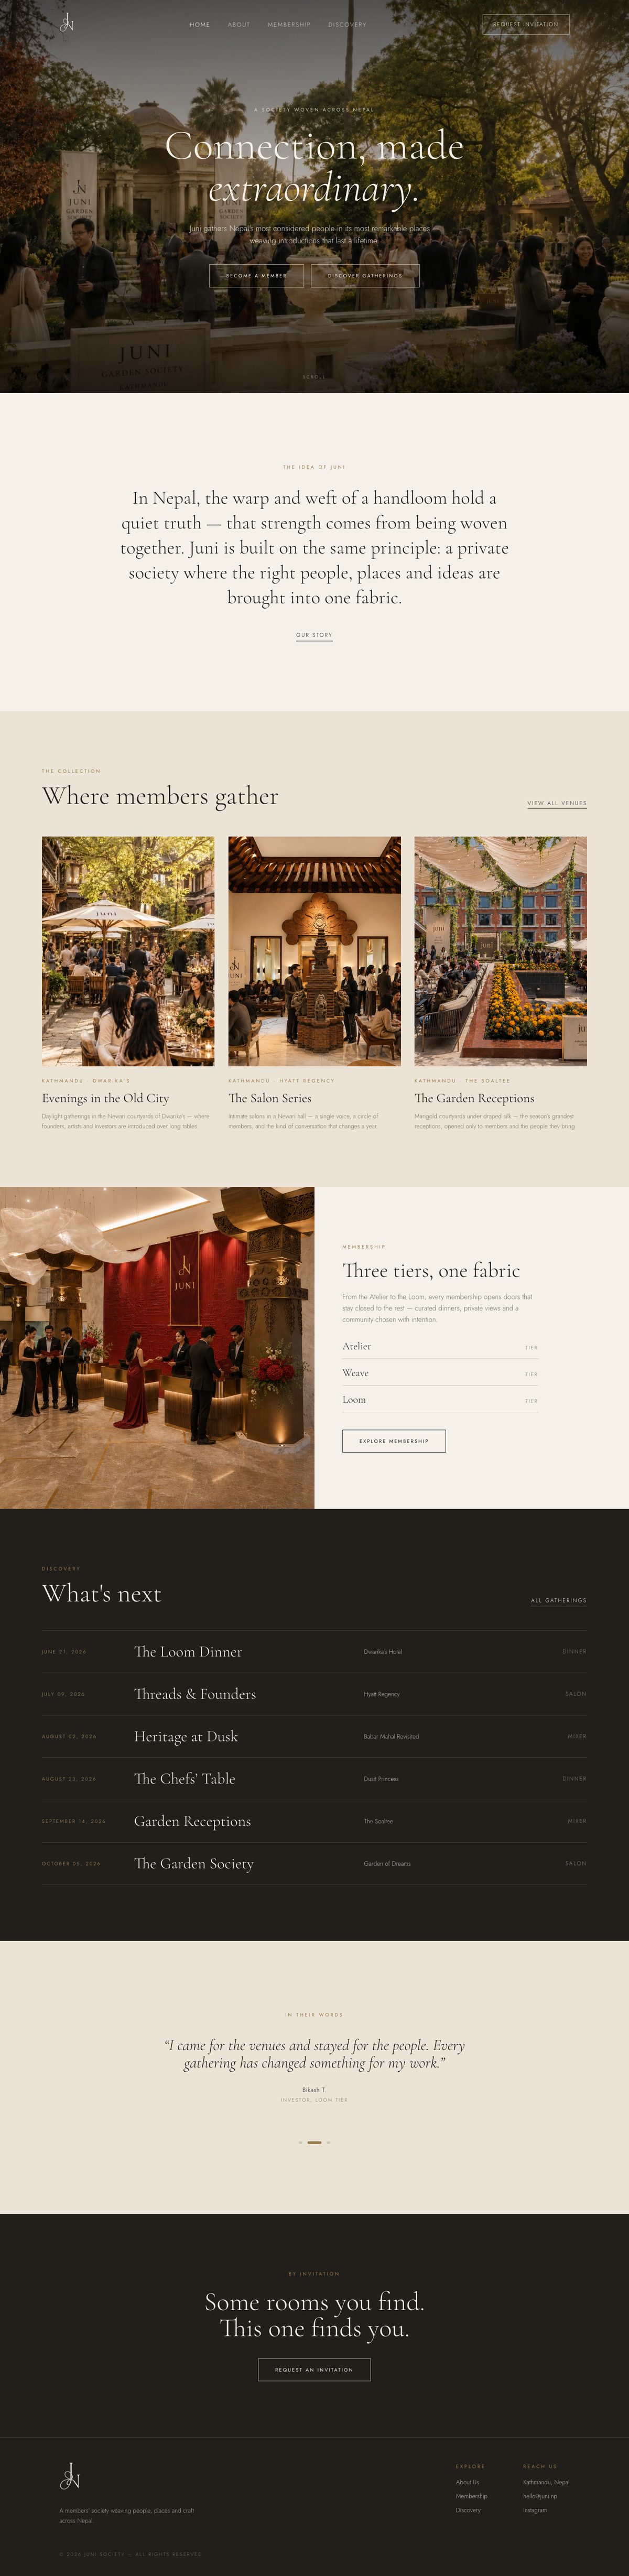
Brand, business strategy and website for JUNI, a private members' society for Kathmandu that brings the right people, places and ideas into one fabric through curated gatherings, tiered memberships and a collection of physical brand pieces.
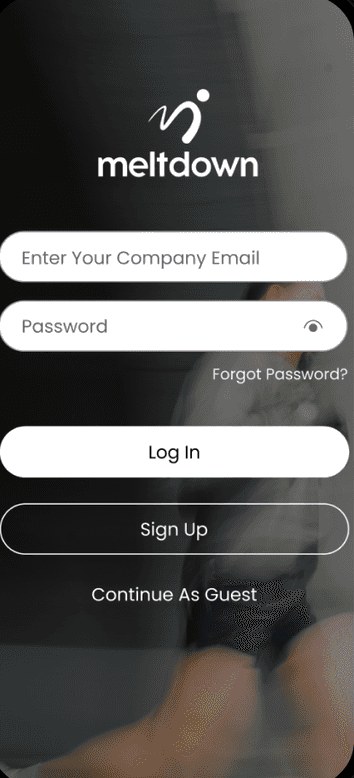
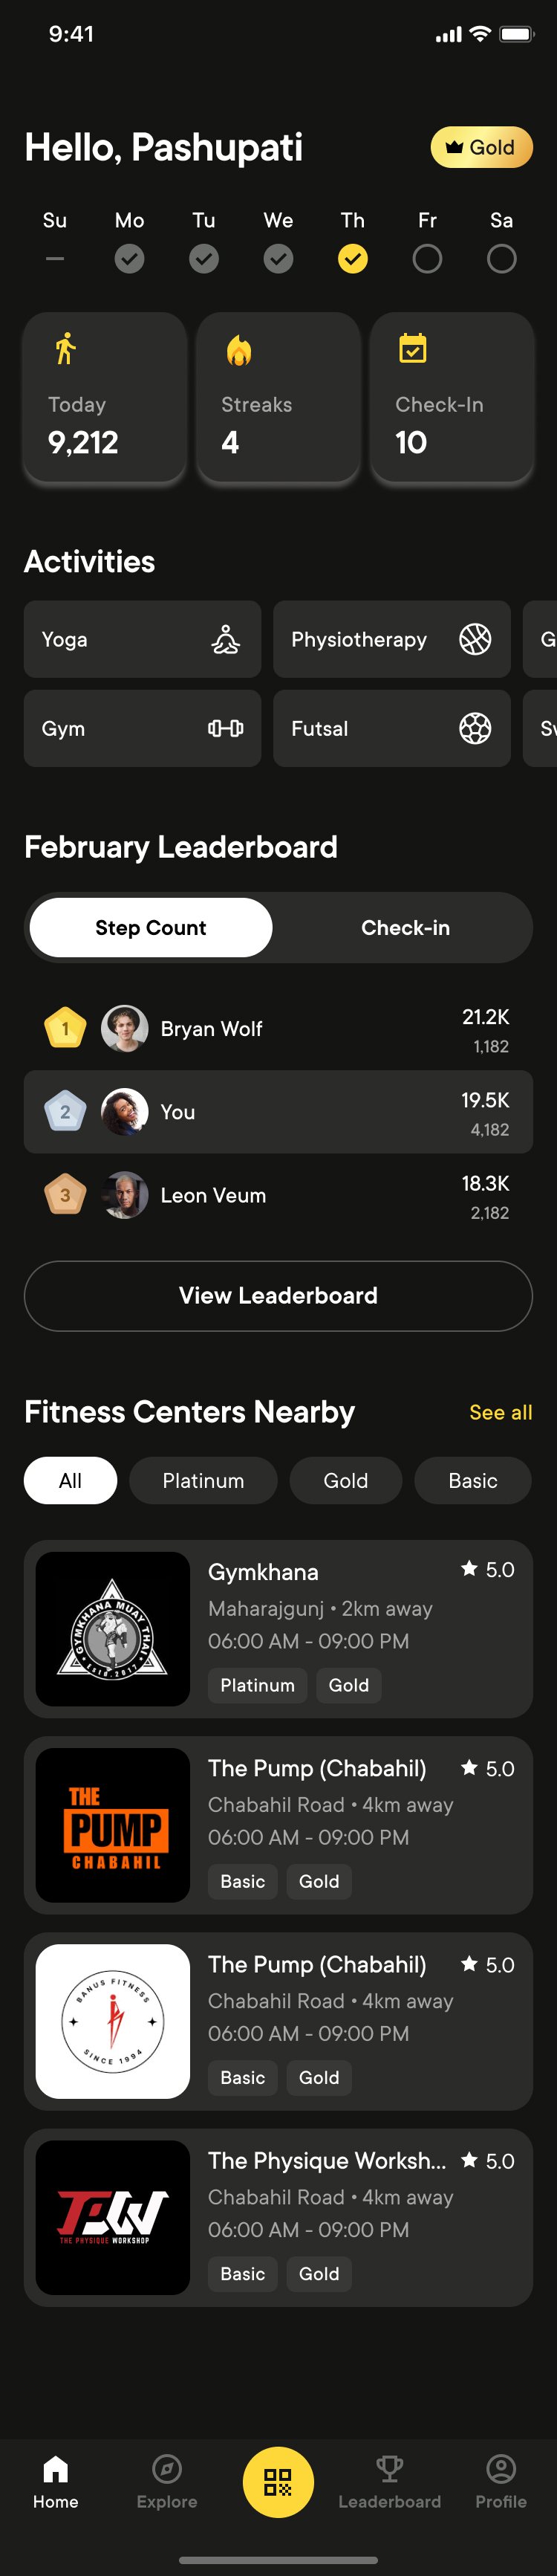
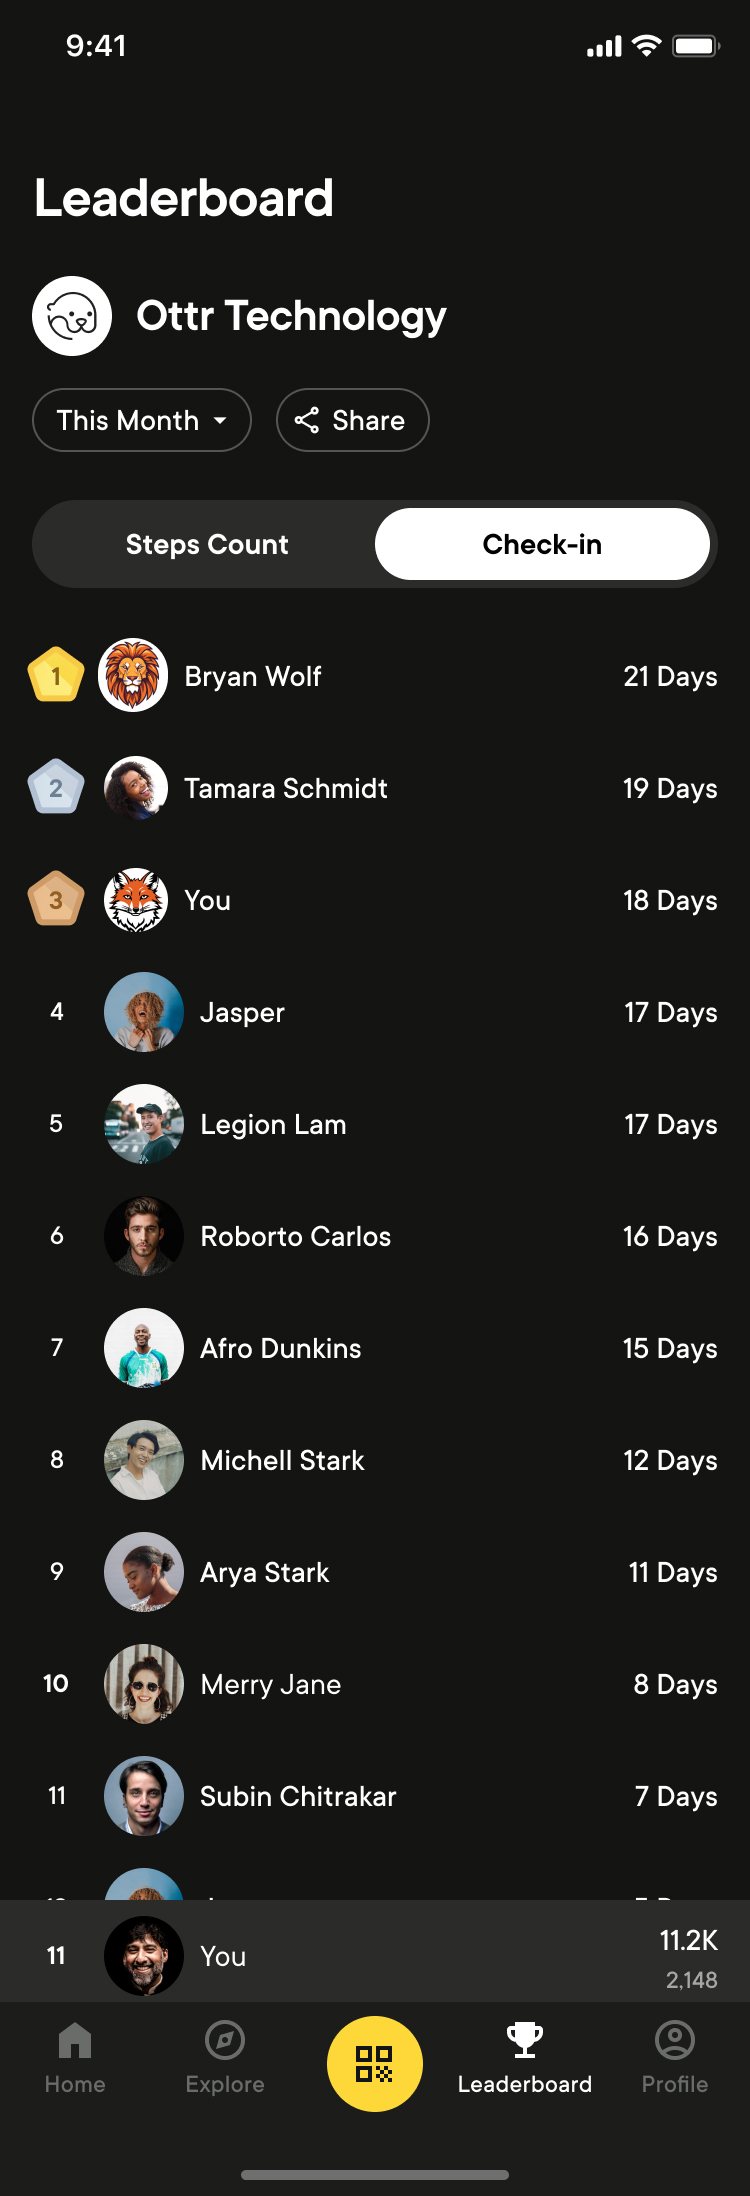
Meltdown is a digital fitness subscription that gives employees one QR code access to multiple gyms, offering multi-location access, reward programs, and community-focused team well-being sessions.
A research-led redesign of the 29 Brews website for the Twenty-Nine Palms Band of Mission Indians: helping taproom visitors choose a beer with confidence and turning the partner sales deck into an interactive B2B experience.